VOLUME 16 NUMBER 1 (January to June 2023)

SciEnggJ. 2023 16 (1) 223-234
available online: June 24, 2023
*Corresponding author
Email Address: aecastro@up.edu.ph
Date received: October 21, 2022
Date revised: May 21, 2023
Date accepted: June 1, 2023
DOI: https://doi.org/10.54645/2023161EUJ-56
ARTICLE
Water Quality Index as a tool for assessing the water quality of the Laguna de Bay from 2020 to 2021
Institute of Biology, College of Science, University of the Philippines
Diliman, Quezon City, NCR, Philippines
2College of Medicine, University of the East
Ramon Magsaysay Memorial Medical Center, Inc., College of Medicine,
University of the East Ramon Magsaysay Memorial Medical Center, Inc.,
Quezon City, NCR, Philippines
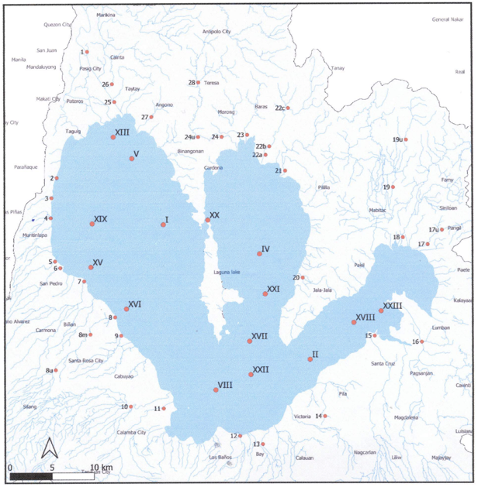
Laguna de Bay (LdB) is a primary freshwater resource that provides multiple ecosystem services. The Laguna Lake Development Authority (LLDA) oversees the periodic monitoring of LdB’s water quality. Data collected by the LLDA can be used to assess LdB’s status using an easily understandable metric. In this study, Water Quality Index (WQI) was used to assess LdB’s quality based on seven parameters (fecal coliform, nitrate, inorganic phosphate, ammonia, biochemical oxygen demand, dissolved oxygen, and pH) measured and recorded by the LLDA from 2020 to 2021. Data from eight major monitoring stations were used to explore how the seven parameters link the stations as well as to compute the WQIs. The lowest WQIs (excellent quality) were obtained using the data representing the end of 2020 for all eight stations, while the highest WQIs (good - poor quality) were obtained for the data measured towards the end of 2021 for Stations I, II, and XVI. Principal Component Analysis (PCA) revealed that the stations had relatively similar environmental influences and overall water quality. Station groupings correspond with the computed WQIs. Stations that had unconventional placements in the biplots (Q3-Q4 of 2021 for Stations I and XVI and Q2 of 2021 for Station V, classified as outliers), correspond to the time points where the lowest water quality was noted. Overall, WQI values are concordant with the water and land use type of the stations. WQI is a useful tool for indicating water quality and is valuable in evaluating LdB and other freshwater resources.
© 2026 SciEnggJ
Philippine-American Academy of Science and Engineering